How to Build an MIS Dashboard Your Investors Will Actually Trust

MIS dashboard for investor-ready monthly financial reporting

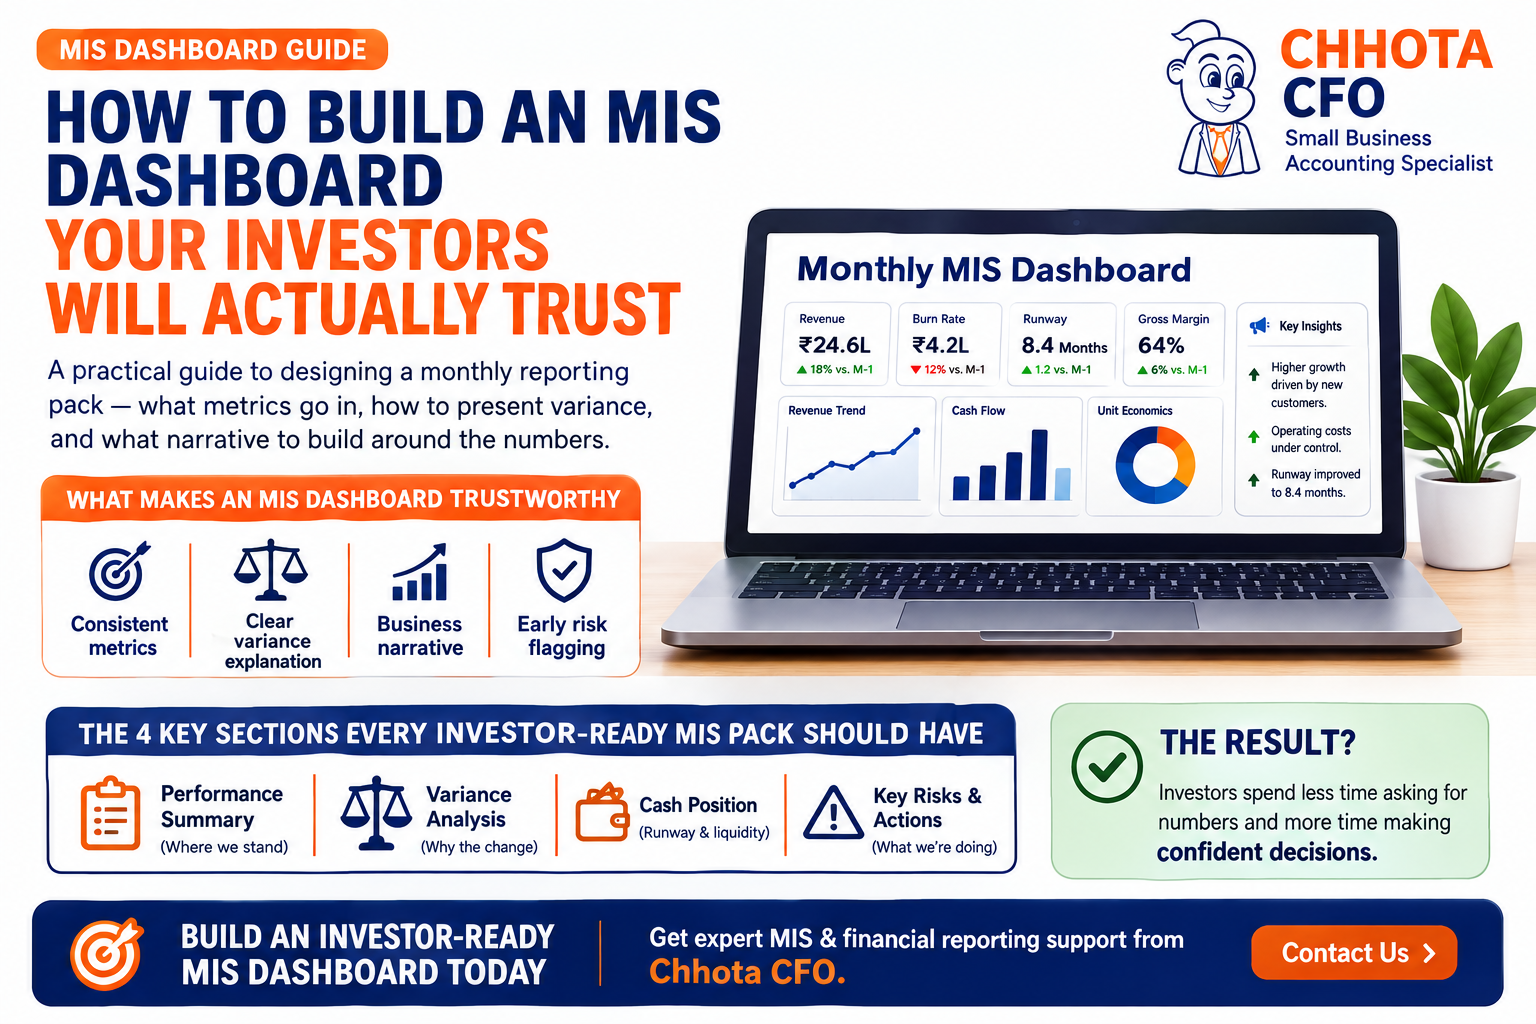
A practical guide to designing a monthly reporting pack—what metrics go in, how to present variance, and what narrative to build around the numbers.

Every founder eventually sends out a monthly MIS pack that goes unread or, worse, gets a one-line reply asking for the numbers they already sent. That’s rarely a data problem. It’s a design problem. Investors don’t distrust dashboards because the numbers are wrong; they distrust them because the dashboard doesn’t answer the three questions that actually matter to a board: Is the business healthy? Is it heading where we said it would? And can I trust the person presenting it to tell me when it isn’t?

At Chhota CFO, we build monthly reporting packs for startups and MSMEs across sectors, and the pattern is consistent: the dashboards that earn trust are not the most detailed ones; they’re the most disciplined ones. Here’s how we structure them.

Build an MIS Dashboard Investors Can Trust

1. Start with the metrics investors actually track.

A trustworthy MIS pack resists the urge to show everything. It leads with a small, consistent set of numbers, tracked the same way every month, so trend lines mean something. Broadly, these fall into four buckets:

Category

Core Metrics

Why It Matters

Frequency

Growth

Revenue, new customers, ARR/MRR growth

Shows momentum against plan

Monthly

Cash & Runway

Burn rate, cash balance, months of runway

Signals when the next raise is needed

Monthly

Unit Economics

CAC, LTV, gross margin, contribution margin

Tests if growth is sustainable

Monthly / Quarterly

Working Capital

Receivables days, payables days, inventory days

Flags liquidity stress early

Monthly

Everything else: departmental spend, cohort detail, product-level splits belongs in an appendix the board can ask for, not the page they see first.

2. Present variance as a story, not a spreadsheet.

Raw actual-vs-budget tables invite investors to hunt for problems themselves, which is exactly the impression a CFO wants to avoid. A stronger format shows three columns: Budget, Actual, Variance, with the variance explained in one line, in business language rather than accounting language.

  • Lead with the number that moved most, not the one that’s easiest to explain.
  • Separate timing variances (a payment that slipped a month) from structural ones (a cost base that has genuinely shifted).
  • Flag unfavourable variances before a board member does; a dashboard that surfaces its own bad news first reads as more credible, not less.
  • Keep variance commentary to two sentences per line item: what happened and what you’re doing about it.

3. Build a narrative around the numbers.

A dashboard is a set of facts; a reporting pack is an argument. The strongest packs we build open with a half-page narrative that does three things: states where the business stands against plan, names the one or two metrics that matter most this month, and previews what’s likely to change next month. This is what shifts a board conversation from “explain these numbers” to “here’s what we should decide.”

Consistency compounds this trust. When the same four sections appear in the same order every month: Performance Summary, Variance Analysis, Cash Position, Key Risks & Actions. Investors stop spending energy on navigation and start spending it on judgment. That’s the real objective of an MIS pack: not to inform, but to free up the board’s attention for decisions that need it.

Where founders usually go wrong

  • Changing the metric set every quarter, which breaks trend visibility just as patterns start to emerge.
  • Reporting vanity metrics (downloads, sign-ups) without the conversion metrics that give them meaning.
  • Sending the pack without a covering narrative, leaving investors to draw their own—often less generous—conclusions.
  • Waiting until the numbers are bad to start explaining variances, instead of building the habit from month one.

The bottom line

Investor trust in an MIS pack is built the same way trust is built anywhere: through consistency, early disclosure of bad news, and a clear point of view on what the numbers mean. Get the structure right once, and the monthly pack stops being a compliance exercise and starts becoming the tool that makes your next fundraising conversation easier.

Talk to Chhota CFO today about building an investor-ready monthly reporting system.

FAQ

What is an MIS dashboard?

An MIS dashboard is a management reporting tool that presents important business, financial and operational metrics in a structured format to help management and investors evaluate performance and make informed decisions.

What should an investor MIS dashboard include?

An investor-focused MIS dashboard should typically include revenue, growth, cash balance, burn rate, runway, unit economics, working capital, budget vs actual performance, key risks and management actions.

What are the most important MIS metrics for startups?

Important startup MIS metrics include revenue, MRR/ARR, customer growth, burn rate, cash runway, CAC, LTV, gross margin, contribution margin and working capital indicators.

How does an MIS dashboard help investors?

An MIS dashboard helps investors understand whether the business is performing against its plan, identify financial risks early and evaluate whether management is making informed decisions.

How often should an MIS report be prepared?

For most startups and growing businesses, an MIS report is prepared monthly. Certain operational or financial metrics may also be monitored weekly or more frequently.

What is variance analysis in MIS reporting?

Variance analysis compares actual business performance with budgeted or forecasted performance and explains why significant differences occurred.

What is the difference between MIS reporting and financial reporting?

Financial reporting primarily focuses on formal financial statements and compliance, while MIS reporting provides management-oriented information, trends, KPIs, variances and operational insights for decision-making.

Why do investors care about MIS reports?

Investors use MIS reports to assess business performance, cash position, growth, profitability, risks and management's ability to identify and address problems.

How can founders make an MIS report more investor-friendly?

Founders should use consistent metrics, clearly explain major variances, highlight risks early, provide concise management commentary and maintain the same reporting structure each month.

Can a Virtual CFO help prepare MIS reports?

Yes. A Virtual CFO can help establish reporting structures, define KPIs, prepare monthly MIS reports, analyse variances and provide management insights for investors and boards.
Book a Call with an expert absolutely FREE for 15 minutes